Journal · Field notes
Matterport in Mumbai: a working guide.
Published October 17, 2025 · Updated July 19, 2026
The Mumbai Metropolitan Region covers a broad range of work here: residential real estate, a national commercial client's local showroom, and hospitality properties on the city's outer edge.
Residential: Goregaon and beyond
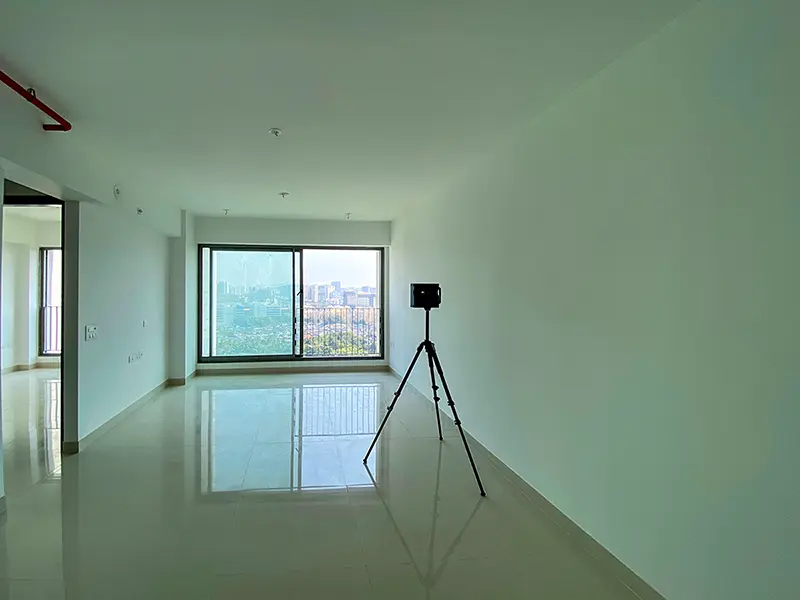
Ivy Homes' Mumbai launch has included around a dozen properties so far, including one in Goregaon, a neighborhood substantially reshaped by real infrastructure in the last few years. Metro Line 2A (the Yellow Line) runs through Goregaon West, connecting to Line 7, and the Goregaon-Mulund Link Road, currently under construction, will open a direct east-west route that hasn't existed before. For remote buyers, NRIs and institutional investors evaluating a property without visiting in person, a walkable, dimensionally accurate tour matters more here than almost anywhere: verifying layout and condition before committing, in a market moving fast enough that waiting for a physical visit can mean losing the property.
dormakaba: one of the earliest, best relationships
dormakaba's Mumbai Customer Experience Centre is one of three showrooms scanned nationally, alongside Bangalore and New Delhi. The relationship came through a Matterport referral, though it's always been direct from there. It's one of the earliest client relationships on this list, and one of the best. The tour functions as a genuine technical catalog: architects and procurement teams evaluating security and access-control hardware can walk through it remotely before any in-person meeting.
Hospitality on the outskirts: Lonavala and Karjat
Radisson Resort & Spa Lonavala and Radisson Blu Plaza Resort Karjat both sit outside the city proper, popular for corporate events and destination weddings precisely because they're a short drive from Mumbai without being in it. A full-property tour lets a corporate planner evaluate a large event space remotely, particularly useful when the alternative is a half-day round trip just to see a ballroom.
What this costs
The rate is flat nationally: ₹1,50,000 per capture day, the same whether the project is in Mumbai, Goregaon, or anywhere else in India. No regional pricing variation.
Before you ask
Worth knowing.
Is pricing different for Mumbai specifically?
No. The rate is a flat ₹1,50,000 per capture day nationally, the same in Mumbai as anywhere else in India.
How many dormakaba showrooms have been documented?
Three, nationally: Bangalore, New Delhi (Okhla), and Mumbai. One of the earliest and best client relationships on this list.
Does the Ivy Homes work in Mumbai include specific neighborhoods?
Yes. Goregaon is one of them, an area seeing real infrastructure change with Metro Line 2A and the Goregaon-Mulund Link Road currently under construction.
Start a project
Tell us about the space, and we'll tell you what it'll take.
Most replies come within a day. Most enquiries start with a short email about the space.
Email info@adostrophe.com